On 24 August, the Department of Communities published the latest edition of its Housing Bulletin for April to June 2023. The bulletin, which is published four times a year, includes a raft of statistics on housing and homelessness.
Homelessness Presentations
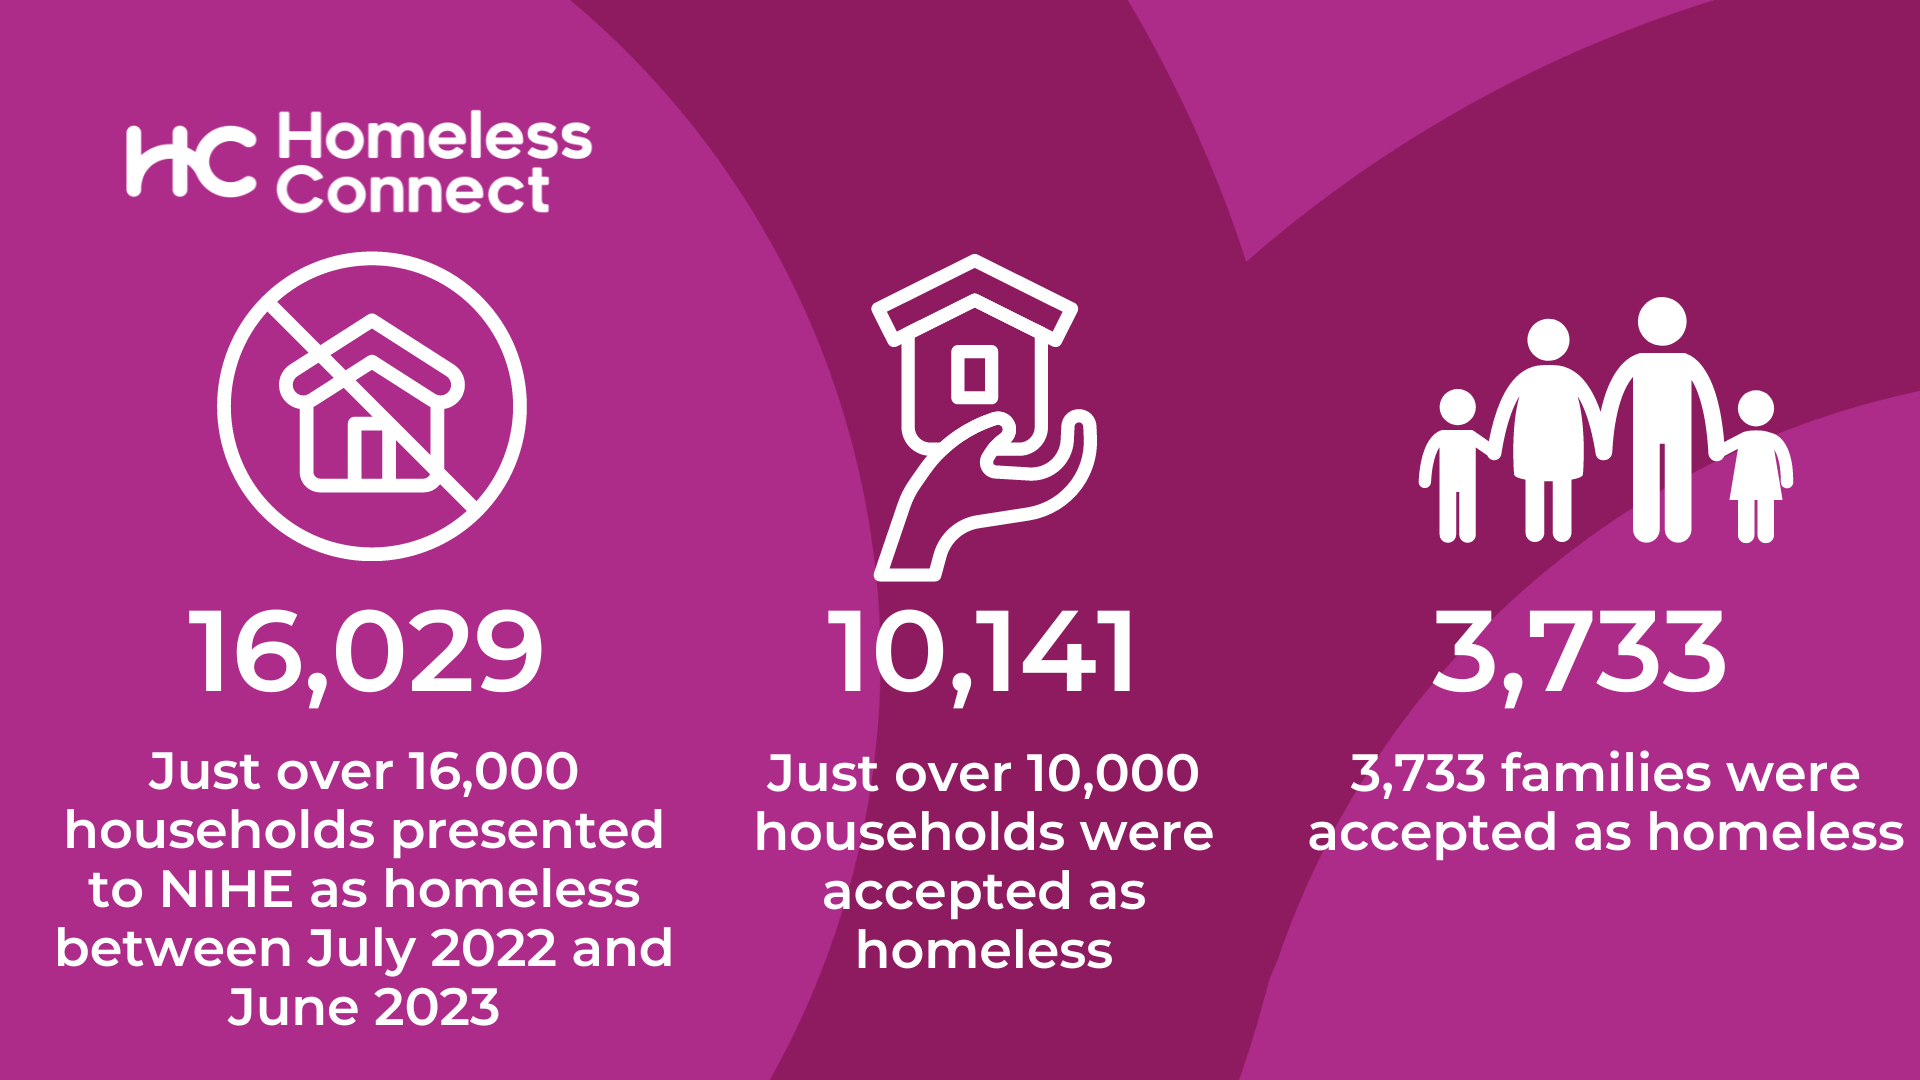
The number of households presenting to the Housing Executive as homeless in April to June 2023 rose slightly to 4176 households, an increase of 1.6% (64 households) on the same quarter last year. From July 2022 to June 2023, 16,029 households presented as homeless. This compared to 15,552 households from July 2021 to June 2022, an increase of 3.1%.
The number of households accepted as homeless following assessment by the Housing Executive fell from 2,686 households in April to June 2022 to 2,478 in the same quarter in 2023, a fall of 7.7%. From July 2022 to June 2023, 10,141 households were accepted as homeless. This was a rise of 190 on the previous year (1.9%).
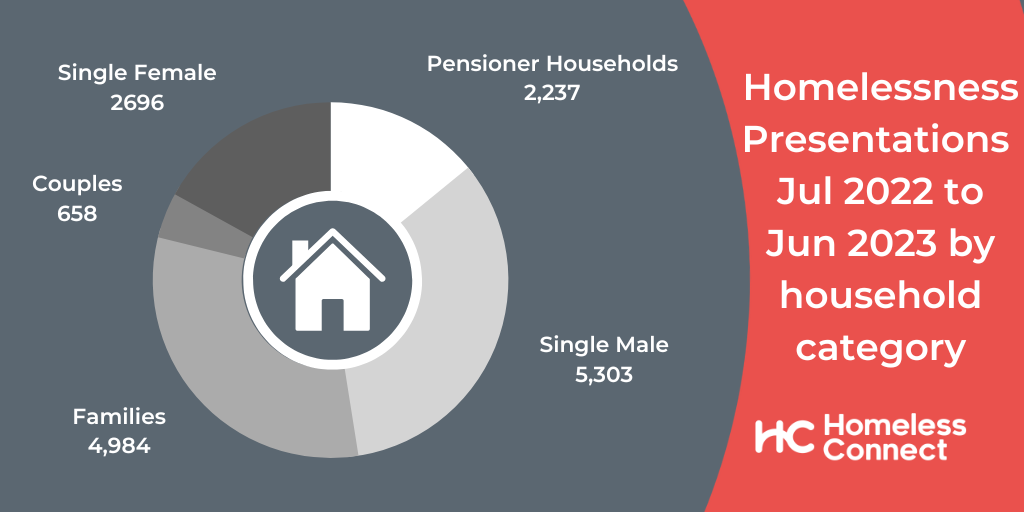
From July 2022 to June 2023, 33.1% of households presenting were single males aged 16-59 (5,303 households); 16.8% were single females aged 16-59 (2,696 households); 4.1% were couples (658 households); 31.1% were families (4,984 households); 14% were pensioner households (2,237 households); and 0.9% were undefined (151 households).
The family type figures in July 2022 to June 2023 were broadly similar with the same period the year before, with a 4.8% rise in the number of families presenting (227 additional families presenting) while the number of single males rose by 0.8% and single females fell by 9.9% respectively.
The table below compares the reasons for presentation in April to June 2022 and April to June 2023. It is important to say that the number of presentations in the two quarters was broadly stable and for some categories relatively small numbers can have a significant impact on the percentage changes recorded.
Households presenting as Homeless by Reason April-June 2022 and April-June 2023
| Household presentation reason | April to June 2022 | April to June 2023 | Increase/Decrease in presentations total between April-June 2022 and April-June 2023 | % increase/decrease |
| Sharing Breakdown/Family Dispute | 887 | 871 | -16 | -1.80% |
| Marital Relationship Breakdown | 436 | 391 | -45 | -10.30% |
| Domestic Abuse | 269 | 293 | 24 | 8.90% |
| Loss of rented accommodation | 869 | 703 | -166 | -19.10% |
| No accommodation in NI | 252 | 262 | 10 | 4.00% |
| Intimidation | 40 | 50 | 10 | 25.00% |
| Accommodation not reasonable | 894 | 1073 | 179 | 20.00% |
| Release from hospital/prison/other institution | 69 | 85 | 16 | 23.20% |
| Fire/Flood/other emergency | 8 | 17 | 9 | 112.50% |
| Mortgage Default | 12 | 13 | 1 | 8.30% |
| Neighbourhood harassment | 326 | 354 | 28 | 8.60% |
| Other reasons | 21 | 23 | 2 | 9.50% |
| No Data on reason for presentation | 29 | 41 | 12 | 41.40% |
| TOTAL | 4112 | 4176 | 64 | 1.60% |
The most noteworthy shifts have been a fall in the number of households presenting due to the loss of rented accommodation and the rise in the number of presentations due to accommodation not being reasonable to occupy.
Homelessness Acceptances
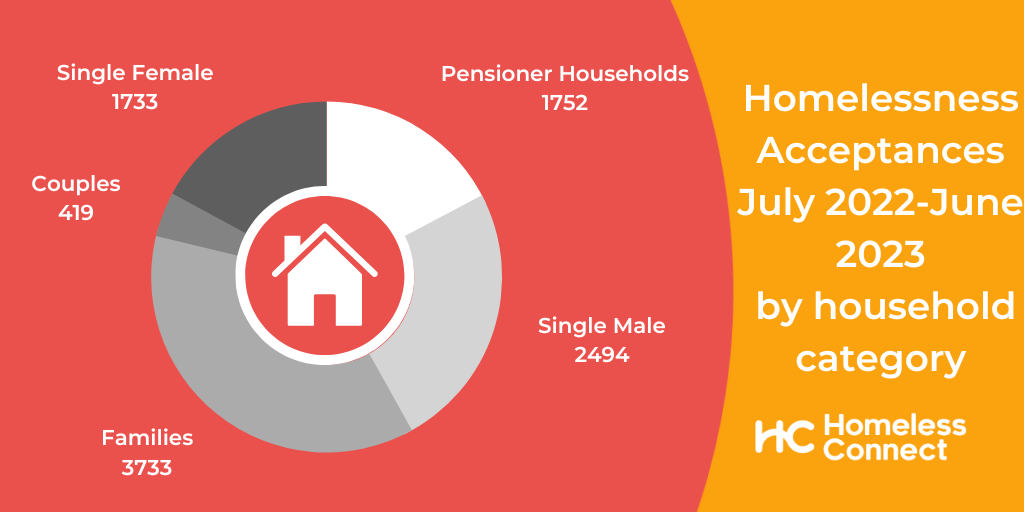
In terms of acceptances, 24.6% of households accepted were single males aged 16-59 (2494 households); 17.1% were single females aged 16-59 (1,733 households); 4.1% were couples (419 households); 36.8% were families (3733 households); and 17.3% were pensioner households (1,752 households) while 0.1% were undefined (12 households).
Compared to the year before, there was a small fall in the number of single males and females aged 15-59 accepted by -1.3% and -2% respectively while the number of couples, families and pensioners increased by 4.2%, 2.3% and 9.5% respectively.
The table below compares the reasons why a household has been accepted as homeless in April to June 2022 and April to June 2023. As with the presentation figures, it is important to say that the number of presentations in the two quarters was broadly stable and for some categories relatively small numbers can have a significant impact on the percentage changes recorded.
Households accepted as homeless by reason April-June 2022 and April to June 2023
| Household acceptance reason | April to June 2022 | April to June 2023 | Increase/Decrease in presentations total between April-June 2022 and April-June 2023 | % increase/decrease |
| Sharing Breakdown/Family Dispute | 510 | 416 | -94 | -18.43% |
| Marital Relationship Breakdown | 184 | 161 | -23 | -12.50% |
| Domestic Abuse | 249 | 242 | -7 | -2.81% |
| Loss of rented accommodation | 583 | 419 | -164 | -28.13% |
| No accommodation in NI | 125 | 110 | -15 | -12.00% |
| Intimidation | 46 | 56 | 10 | 21.74% |
| Accommodation not reasonable | 745 | 815 | 70 | 9.40% |
| Release from hospital/prison/other institution | 43 | 52 | 9 | 20.93% |
| Fire/Flood/other emergency | 7 | * | ||
| Mortgage Default | * | * | ||
| Neighbourhood harassment | 173 | 185 | 12 | 6.94% |
| Other reasons | 15 | 10 | -5 | -33.33% |
| TOTAL | 2686 | 2478 | -208 | -7.74% |
The Social Housing Waiting List
The social housing waiting list stood at 45,292 households on 30 June 2023. This is up 2.4% on the same quarter last year, when the list stood at 44,229. The number of households deemed to be in “housing stress” has also continued to rise. A household in housing stress is any household which has 30 or more points for the purposes of the social housing selection scheme and consequently includes households deemed to have homelessness status (who are granted 70 points).
On 30 June 2022, 31,663 households on the list were assessed as being in housing stress. In June 2023, this had risen to 33,130, a rise of 4.6%.
While the number of households with homelessness status is not provided in the statistics, we know from other sources that on 1 June 2023, 26,745 households had homelessness status.
The table below shows the equivalent figures over the last decade.
Social Housing Waiting List Data 2013-2023
| Date | Total on Social Housing Waiting List | Total in Housing Stress | Total with Homelessness Status |
| Mar-13 | 41356 | 22414 | 12431 |
| Mar-14 | 39967 | 21586 | 12276 |
| Mar-15 | 39338 | 22097 | 13644 |
| Mar-16 | 37586 | 22645 | 15075 |
| Mar-17 | 37611 | 23694 | 16356 |
| Mar-18 | 36198 | 24148 | 17520 |
| Mar-19 | 37586 | 26387 | 19629 |
| Mar-20 | 38745 | 27745 | 20951 |
| Mar-21 | 43971 | 30288 | 22217 |
| Mar-22 | 44426 | 31407 | 23978 |
| Mar-23 | 45105 | 32633 | 26310 |
| Jun-23 | 45292 | 33130 | 26745 |
| % Change March 13 to June 23 | 9.50% | 47.80% | 115.10% |
This table highlights the stark rise in the number of households in housing need over the last decade. While the overall social housing list has only grown by 3936, the needs of those on the list have increased with an additional 14,314 full duty applicants being added over that time.
In the last year, the number of households in housing stress have increased in 10 local council areas across NI (the exception being Lisburn and Castlereagh) while the social housing waiting list has increased in nine of them (the exceptions being Armagh, Banbridge and Craigavon and Lisburn and Castlereagh). The highest percentage increase in the social housing waiting list and the numbers in housing stress was recorded in Mid and East Antrim.
Social Housing Waiting List Data by Local Council June 2022- June 2023
| New local government district | Total Applicants June 2022 | Number of Applicants in Housing Stress June 2022 | Total Applicants June 2023 | Number of applicants in Housing Stress June 2023 | % Change in Total | % Change in Housing Stress |
| Antrim & Newtownabbey | 2,924 | 2,198 | 3150 | 2420 | 7.73% | 10.10% |
| Ards & North Down | 3,162 | 2,176 | 3291 | 2309 | 4.08% | 6.11% |
| Armagh City, Banbridge & Craigavon | 3,771 | 2,321 | 3744 | 2325 | -0.72% | 0.17% |
| Belfast | 12,090 | 9,284 | 12105 | 9580 | 0.12% | 3.19% |
| Causeway Coast & Glens | 3,486 | 1,957 | 3619 | 2128 | 3.82% | 8.74% |
| Derry City & Strabane | 5,498 | 4,089 | 5803 | 4360 | 5.55% | 6.63% |
| Fermanagh & Omagh | 2,057 | 1,395 | 2058 | 1424 | 0.05% | 2.08% |
| Lisburn & Castlereagh | 2,460 | 1,859 | 2430 | 1858 | -1.22% | -0.05% |
| Mid & East Antrim | 2,781 | 1,946 | 3025 | 2177 | 8.77% | 11.87% |
| Mid Ulster | 2,161 | 1,344 | 2191 | 1386 | 1.39% | 3.13% |
| Newry, Mourne & Down | 3,839 | 3,094 | 3876 | 3163 | 0.96% | 2.23% |
| Total | 44,229 | 31,663 | 45292 | 33130 | 2.40% | 4.63% |
You can read Homeless Connect’s response to the figures here.
You can read the Housing Bulletin in full here.
You can find the historical social housing waiting list data here.