On 23 November, the Department of Communities published the latest edition of its Housing Bulletin for July to September 2023. The bulletin, which is published four times a year, includes a raft of statistics on housing and homelessness.
Homelessness Presentations
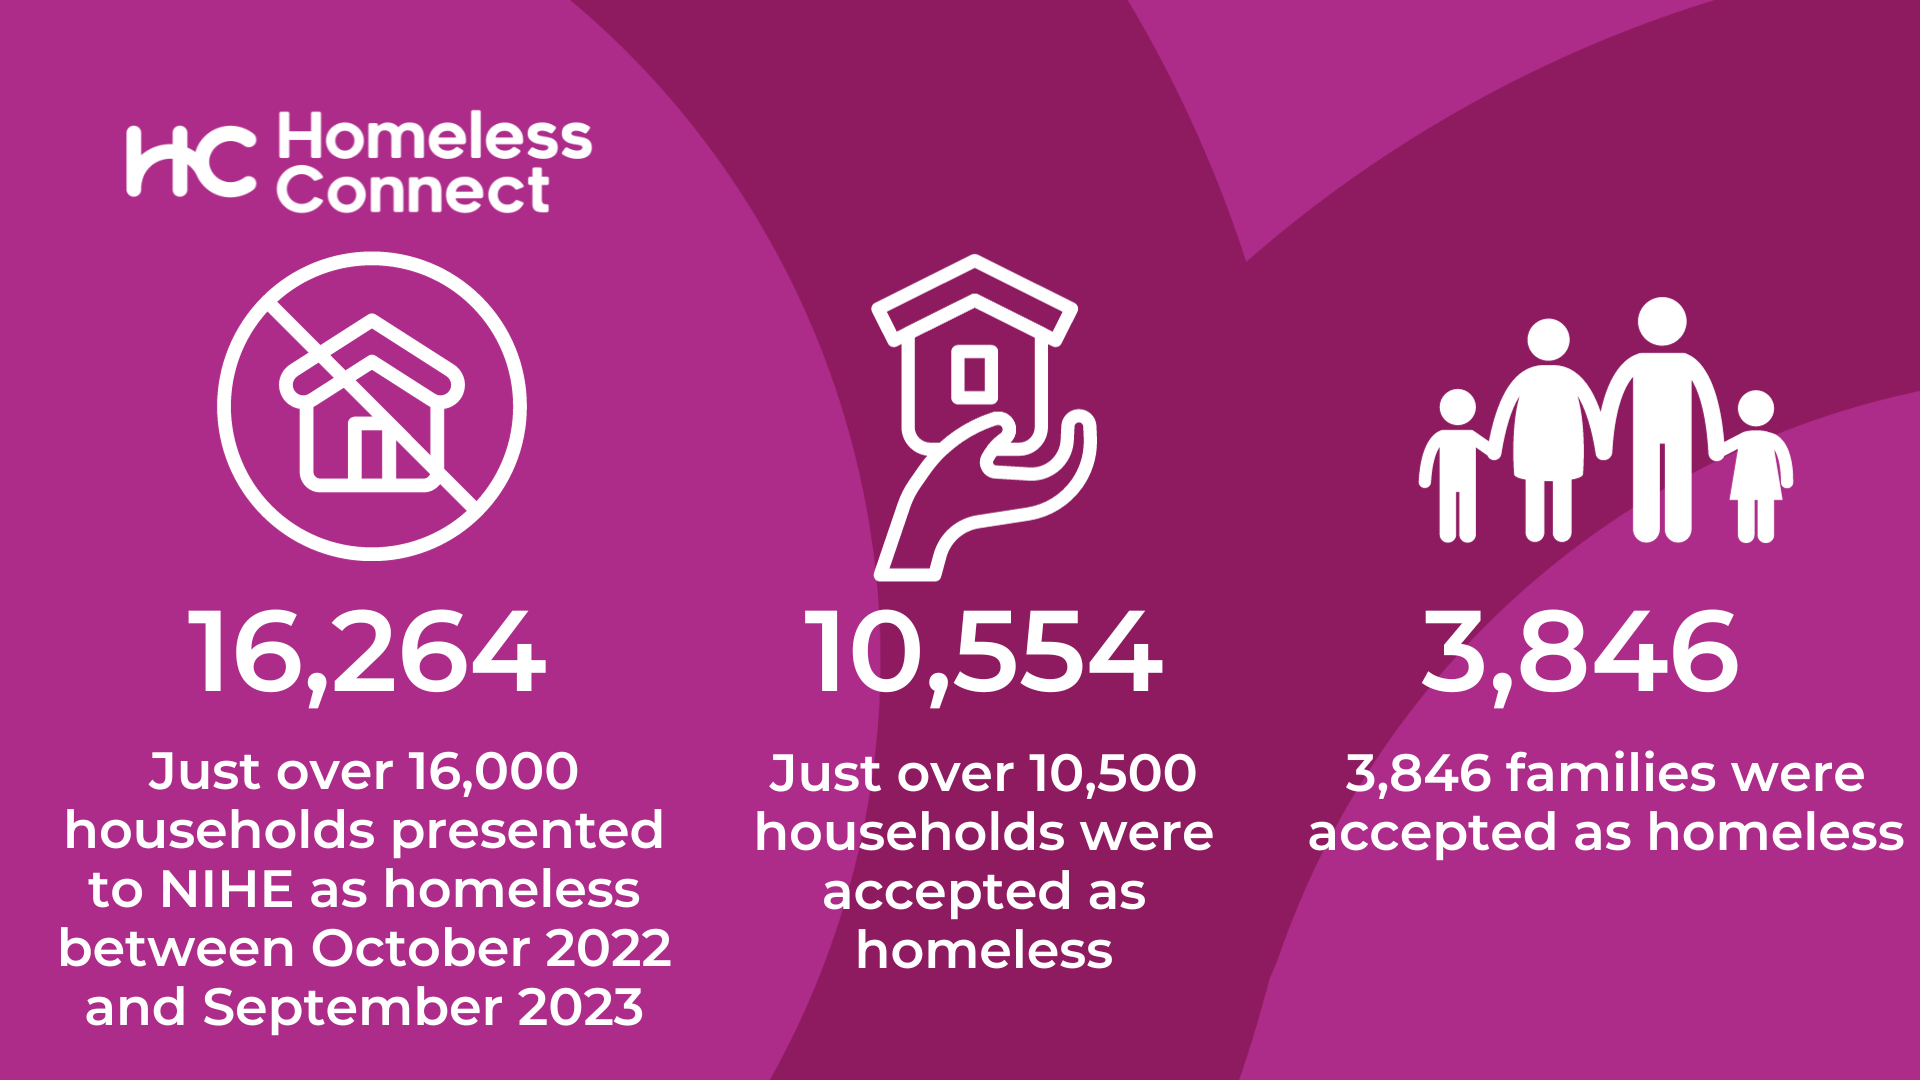
The number of households presenting to the Housing Executive as homeless in July to September 2023 rose to 4,262 households, an increase of 4.8% (195 households) on the same quarter last year. From October 2022 to September 2023, 16,264 households presented as homeless. This compared to 15,581 households in the same period the year before, an increase of 4.4%.
The number of households accepted as homeless following assessment by the Housing Executive marginally fell from 2,636 households in July to September 2022 to 2,605 in the same quarter in 2023, a fall of 1.2% (31 households). From October 2022 to September 2023, 10,554 households were accepted as homeless. This was a rise of 625 on the previous year (6.3%).
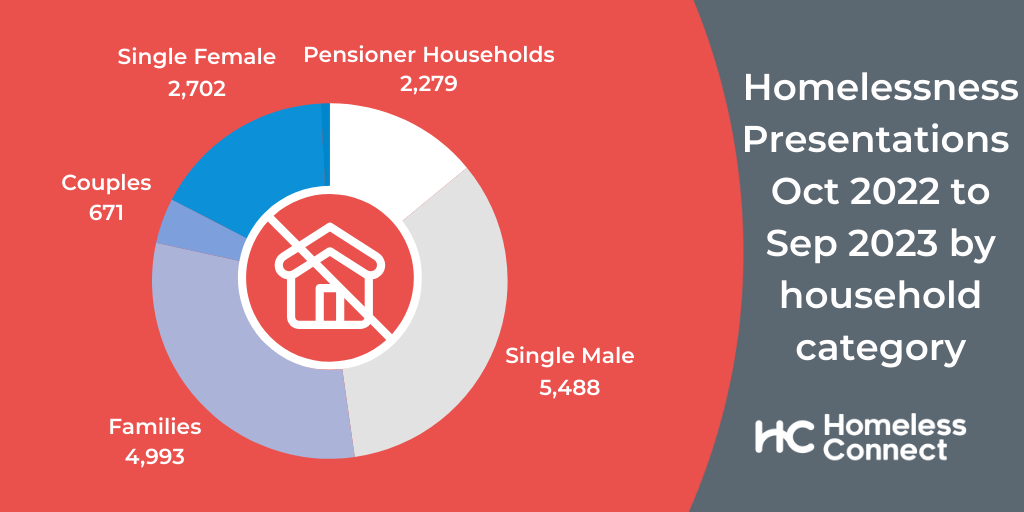
Comparing the household type in homelessness presentations in October 22 to September 23 with the previous year, we see an increase in presentations across all household types.
| Household Type | Oct 21 to Sep 22 | Oct 22 to Sep 23 | % Change |
| Single Males | 5,185 | 5,488 | 5.8 |
| Single Females | 2,684 | 2,702 | 0.7 |
| Couples | 638 | 671 | 5.2 |
| Pensioner Households | 2,110 | 2,279 | 8 |
| Families | 4,834 | 4,993 | 3.3 |
The table below compares the reasons for presentation in July to September 2022 with July to September 2023. It is important to say that the number of presentations in the two quarters was broadly stable and for some categories relatively small numbers can have a significant impact on the percentage changes recorded.
| Household presentation reason | July to Sep 2022 | July to Sep 2023 | Increase/Decrease in presentations | % increase/decrease |
| Sharing Breakdown/Family Dispute | 869 | 961 | 92 | 10.6 |
| Marital Relationship Breakdown | 416 | 407 | -9 | -2.2 |
| Domestic Abuse | 301 | 291 | -10 | -3.3 |
| Loss of rented accommodation | 771 | 690 | -81 | -10.5 |
| No accommodation in NI | 227 | 347 | 120 | 52.9 |
| Intimidation | 40 | 48 | 8 | 20 |
| Accommodation not reasonable | 918 | 1,023 | 105 | 11.4 |
| Release from hospital/prison/other institution | 73 | 63 | -10 | -13.7 |
| Fire/Flood/other emergency | 18 | 15 | -3 | -16.7 |
| Mortgage Default | 15 | 19 | 4 | 26.7 |
| Neighbourhood harassment | 374 | 344 | -30 | -8 |
| Other reasons | 14 | 20 | 6 | 42.9 |
| No Data on reason for presentation | 31 | 34 | 3 | 9.7 |
| TOTAL | 4,067 | 4,262 | 195 | 4.8 |
The most noteworthy changes are the increases in the numbers of households presenting as a result of having accommodation deemed not reasonable to occupy, sharing breakdown/family dispute and having no accommodation in NI as well as the fall in the numbers of households presenting due to loss of rented accommodation.
Homelessness Acceptances
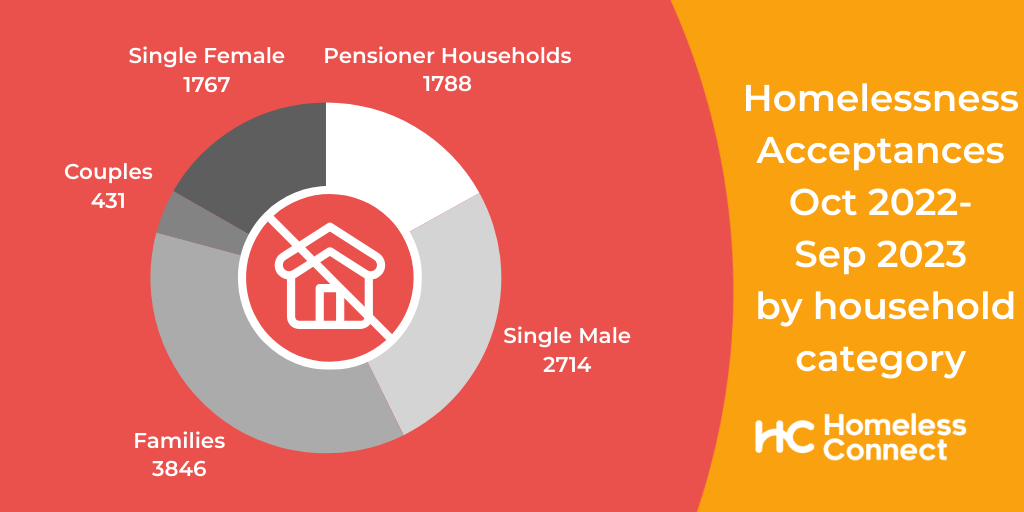
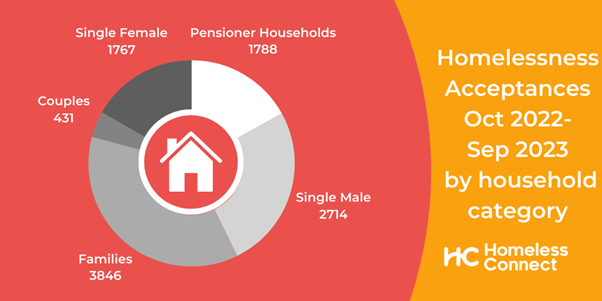
Comparing the household type in homelessness acceptances in October 22 to September 23 with the previous year, we see an increase in acceptances across all household types.
| Household Type | Oct 21 to Sep 22 | Oct 22 to Sep 23 | % Change |
| Single Males | 2,465 | 2,714 | 10.1 |
| Single Females | 1,732 | 1,767 | 2 |
| Couples | 397 | 431 | 8.6 |
| Pensioner Households | 1,626 | 1,788 | 10 |
| Families | 3,697 | 3,846 | 4 |
The table below compares the reasons why a household has been accepted as homeless in April to June 2022 and April to June 2023. As with the presentation figures, it is important to say that the number of presentations in the two quarters was broadly stable and for some categories relatively small numbers can have a significant impact on the percentage changes recorded.
Households accepted as homeless by reason July to September 2022 compared to July to September 2023
| Household Acceptance Reason | July to Sep 2022 | July to Sep 2023 | Increase/Decrease in presentations | % increase/decrease |
| Sharing Breakdown/Family Dispute | 464 | 482 | 18 | 3.9 |
| Marital Relationship Breakdown | 177 | 174 | -3 | -1.69 |
| Domestic Abuse | 292 | 257 | -35 | -12 |
| Loss of rented accommodation | 498 | 425 | -73 | -14.7 |
| No accommodation in NI | 115 | 200 | 85 | 73.9 |
| Intimidation | 69 | 47 | -22 | -31.9 |
| Accommodation not reasonable | 762 | 789 | 27 | 3.54 |
| Release from hospital/prison/other institution | 47 | 33 | -14 | -29.8 |
| Fire/Flood/other emergency | 12 | 13 | 1 | 8.3 |
| Mortgage Default | <5 | 8 | ||
| Neighbourhood harassment | 180 | 167 | -13 | -7.2 |
| Other reasons | 15 | 10 | -5 | -33.3 |
| TOTAL | 2,636 | 2,605 | -31 | -1.2 |
The most noteworthy changes recorded here are the rises in the number of households accepted as homeless due to a lack of accommodation in NI and the fall in acceptances due to the loss of private accommodation.
Finally, it is worth noting that from October 2022 to September 2023, 5,710 households who presented as homeless to the Housing Executive were not accepted as being homeless, 35.1% of the total number of presentations. This significantly varies by household type.
| Household Type | Presentations | Acceptances | % Accepted |
| Single Males | 5,488 | 2,714 | 49.5 |
| Single Females | 2,702 | 1,767 | 65.4 |
| Couples | 671 | 431 | 64.2 |
| Pensioner Households | 2,279 | 1,788 | 78.5 |
| Families | 4,993 | 3,846 | 77 |
| TOTAL | 16,264 | 10,554 | 64.9 |
There are a wide range of reasons as to why a household who present to the Housing Executive may not be accepted as homeless. You can read more about the process on our FAQs page.
The Social Housing Waiting List
The social housing waiting list stood at 45,615 households on 30 September 2023. This is up 2.4% (1,083 households) on the same quarter last year, when the list stood at 44,532. The number of households deemed to be in “housing stress” has also continued to rise. A household in housing stress is any household which has 30 or more points for the purposes of the social housing selection scheme and consequently includes households deemed to have homelessness status (who are granted 70 points).
On 30 September 2022, 32,153 households on the list were assessed as being in housing stress. In June 2023, this had risen to 33,587, a rise of 4.5% (1,434 households)
While the number of households with homelessness status is not provided in the statistics, we know from other sources that on 30 June 2023, 26,999 households had homelessness status.
The table below shows the equivalent figures over the last decade.
Social Housing Waiting List Figures
| Date | Total on Social Housing Waiting List | Total in Housing Stress | Total with Homelessness Status |
| Mar-13 | 41356 | 22414 | 12431 |
| Mar-14 | 39967 | 21586 | 12276 |
| Mar-15 | 39338 | 22097 | 13644 |
| Mar-16 | 37586 | 22645 | 15075 |
| Mar-17 | 37611 | 23694 | 16356 |
| Mar-18 | 36198 | 24148 | 17520 |
| Mar-19 | 37586 | 26387 | 19629 |
| Mar-20 | 38745 | 27745 | 20951 |
| Mar-21 | 43971 | 30288 | 22217 |
| Mar-22 | 44426 | 31407 | 23978 |
| Mar-23 | 45105 | 32633 | 26310 |
| Sep 2023 | 45,615 | 33,587 | 26,999 (on 30 June) |
| % Change March 13 to Sep 23 | 10.3 | 49.8 | 117.2 |
Social Housing Waiting List Data 2013-2023
The social housing waiting list continues the trend of growing quarter by quarter. In addition to that, the level of need of households on the list has substantially grown. In March 2013, 54.2% of households on the list were found to be in housing stress. In September 2023, this now stands at 73.6%.
In the last year, the number of households in housing stress have increased in 10 local council areas across NI (the exception being Lisburn and Castlereagh) while the social housing waiting list has increased in nine of them (the exceptions being Lisburn and Castlereagh and Newry, Mourne and Down). The highest percentage increase in the social housing waiting list and the numbers in housing stress was recorded in Mid and East Antrim.
Social Housing Waiting List Data by Local Council September 2022 to September 2023
| New local government district | Total Applicants September 2022 | Number of Applicants in Housing Stress September 2022 | Total Applicants September 2023 | Number of applicants in Housing Stress September 2023 | % Change in Total | % Change in Housing Stress |
| Antrim & Newtownabbey | 3,006 | 2,278 | 3,225 | 2,473 | 7.3 | 8.6 |
| Ards & North Down | 3,206 | 2,221 | 3,285 | 2,346 | 2.5 | 5.6 |
| Armagh City, Banbridge & Craigavon | 3,753 | 2,329 | 3,779 | 2,336 | 0.7 | 0.3 |
| Belfast | 12,074 | 9,385 | 12,232 | 9,746 | 1.3 | 3.8 |
| Causeway Coast & Glens | 3,516 | 2,029 | 3610 | 2,149 | 2.7 | 5.9 |
| Derry City & Strabane | 5,527 | 4,106 | 5,824 | 4,408 | 5.4 | 7.4 |
| Fermanagh & Omagh | 2,039 | 1,403 | 2,072 | 1,434 | 1.6 | 2.2 |
| Lisburn & Castlereagh | 2,489 | 1,878 | 2,446 | 1,874 | -1.7 | -0.2 |
| Mid & East Antrim | 2,888 | 2,042 | 3,021 | 2,202 | 4.6 | 7.8 |
| Mid Ulster | 2,160 | 1,361 | 2,252 | 1,415 | 4.3 | 4.0 |
| Newry, Mourne & Down | 3,874 | 3,121 | 3,869 | 3,174 | -0.1 | 1.7 |
| Total | 44,229 | 31,663 | 45,615 | 33,587 | 3.1 | 6.1 |
It will be evident from these figures that the housing and homelessness picture in Northern Ireland is continuing to deteriorate. Without properly funded and well-planned interventions, this trend is tragically only likely to continue in the months to come.
The homelessness sector, working with its statutory partners, does help to prevent and alleviate homelessness for thousands of people in NI every year. However, too many people are still falling in to homelessness. As a society we need to work collectively to turn the tide. During Homelessness Awareness Week next week, events are taking place right across NI where we will consider the steps we collectively need to take if we are to take the journey to end homelessness.
You can read the Housing Bulletin in full here.
You can find the historical social housing waiting list data here.